#Release
BARBE - DESIGN / RESEARCH|Webサイト リニューアル
BARBEのウェブサイトリニューアルにともない、ウェブサイトのタイトルを「BARBE - DESIGN / RESEARCH」へと一新いたしました。これまでのクライアントワークに加え、デザインにおける研究(Research)や資料(Resources)の準備を進めています。
本サイト(BARBE - DESIGN / RESEARCH)では、デザインの実践と理論の両面から、より質の高いデザインと情報の集約を目指します。サイトは都度アップデートを行なっていきます。サイトデザイン含め各コンテンツ記事などを少しづつ作成公開してきます。
また、これまでのクライアントワークも整理しています。
制作やプロジェクトのご相談、お見積り、講演・取材などのご依頼、その他についてのお問合せは、問い合わせフォームよりご連絡ください。
各コンテンツは下記内容について更新されます。
News | BARBE、デザインについてのニュース及びお知らせ |
|---|---|
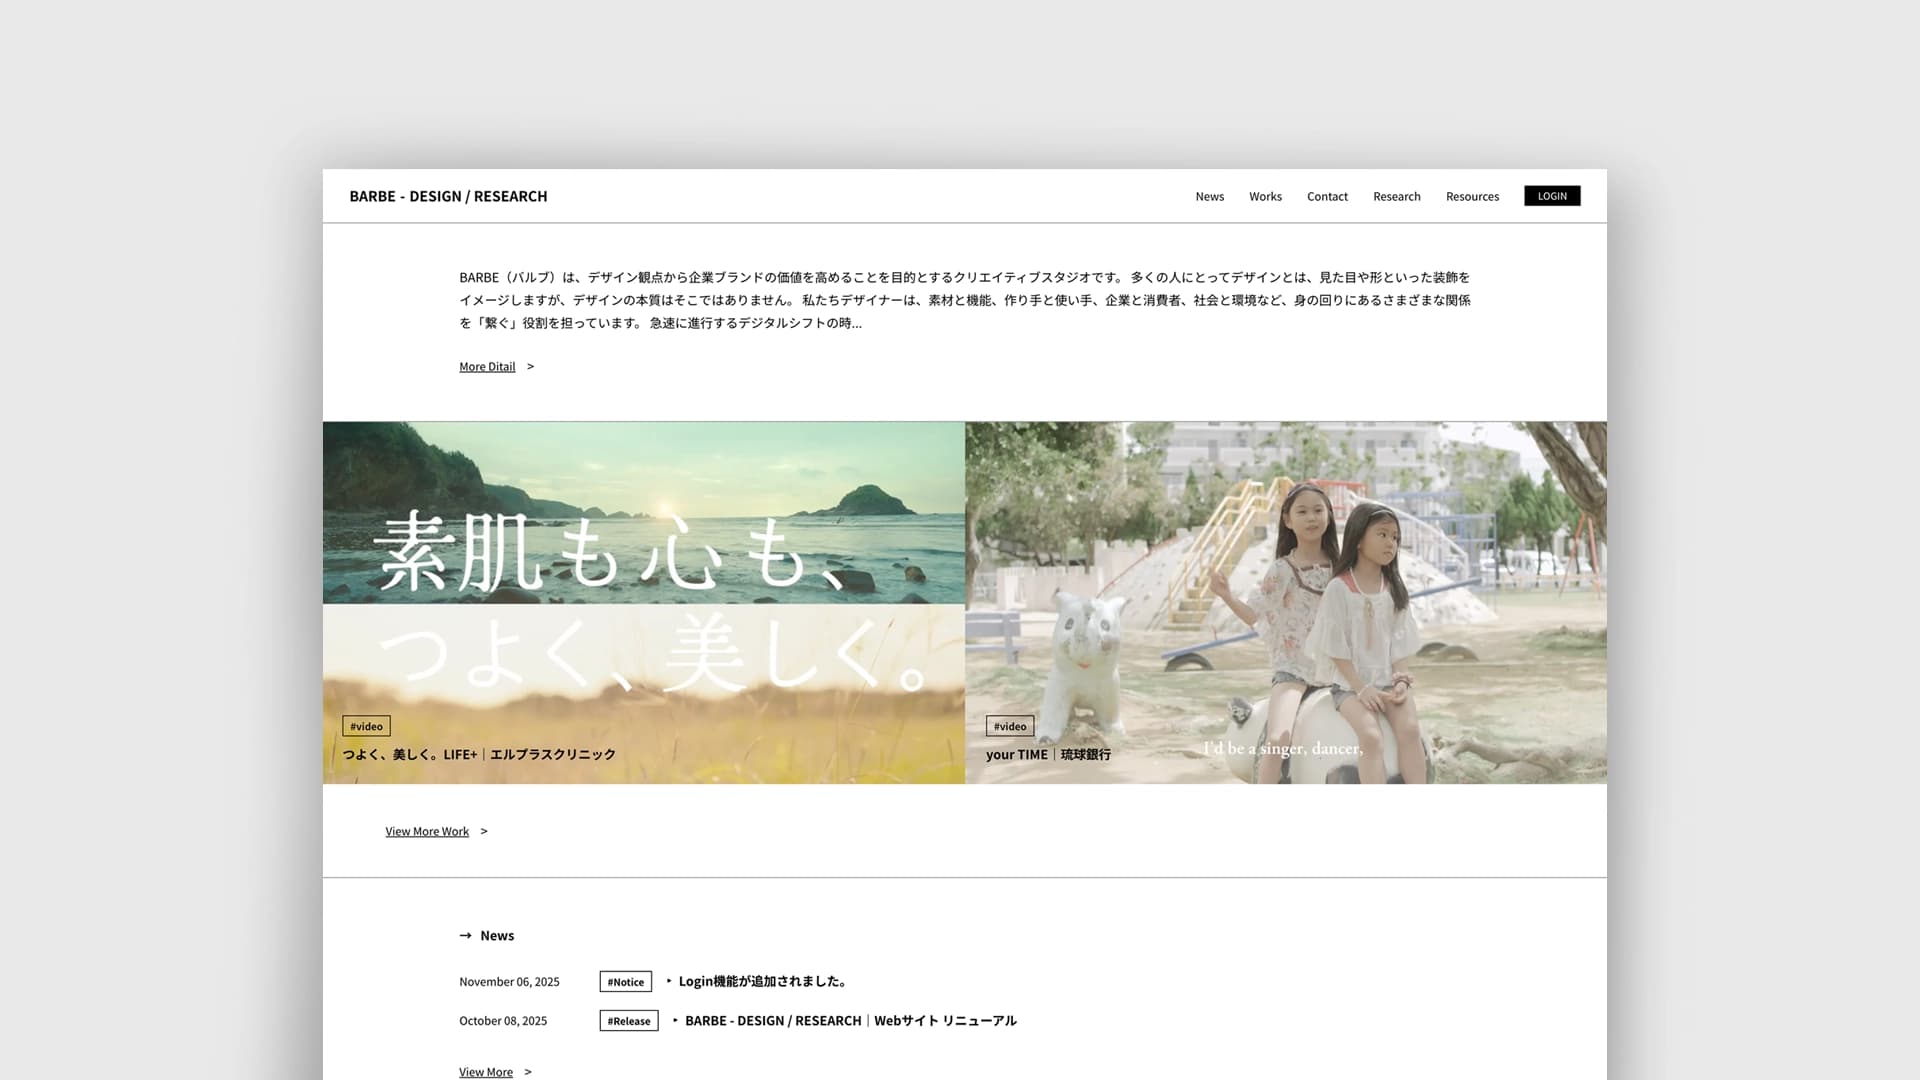
Works | クライアントワークの紹介 |
Contact | お問い合わせフォーム |
Research | 研究、調査、レポート等 |
Resources | 授業内容、資料、書籍 等 |
Login | 内部資料へのアクセス |